
Figure 3. Specific metabolomic profile of tumor cells at the invasive front (MIF) and the cells that are located in the surface of the tumor (SEC).
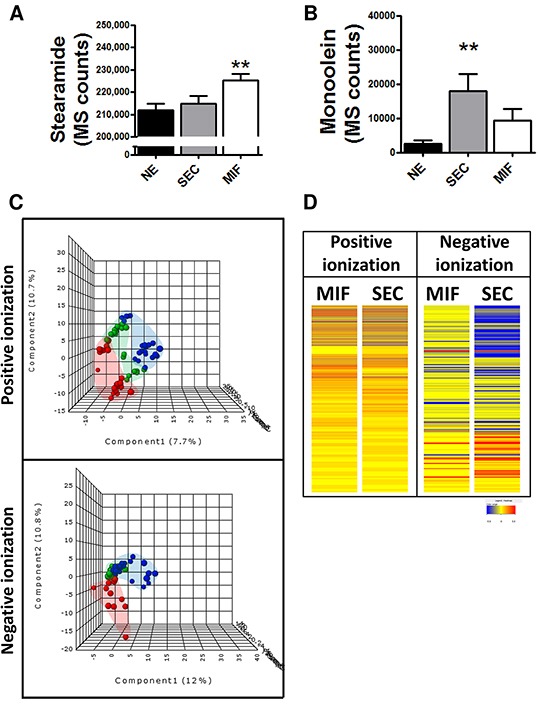
Differential levels of stearamide A. and monoolein B. according to tumor depth. *P<0.05 C. PLS-DA graphs demonstrating different metabolomic profiles. Red spots represents normal endometrium samples, blue spots samples from surface endometrioid carcinoma and green spots from myometrial invasive front.PLS-DA model out of bag error is 0.261 for positive and 0.377 for negative ionization D. Heat map showing the molecular features (see main text for definition) found myometrial invasive front (MIF) and surface endometrioid carcinoma (SEC) in metabolomic analysis. Individual scale maps for heat intensity are shown below each sample type.