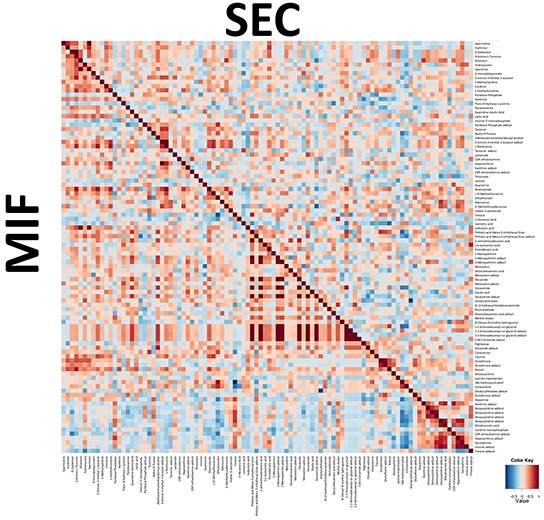
Figure 4. Integration of metabolic correlations of of tumor cells at the invasive front (MIF) and the cells that are located in the surface of the tumor (SEC).

The pixel maps were derived from correlation analyses between different identified metabolites. The cutoff value of 0.6 was applied to the absolute PC value for displaying the correlations between metabolites, shown as a color-coded pixel map (gradient of red colors for positive values and gradient of blue colors for negative values).
