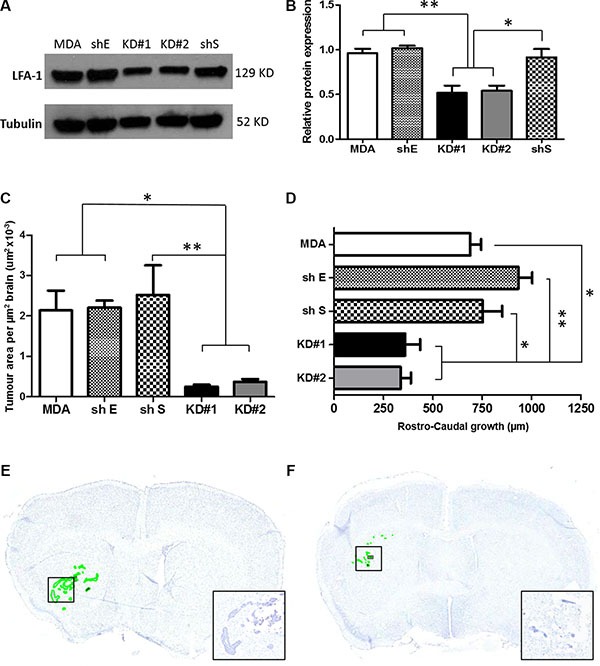
Figure 3.

(A) Western blot showing the levels of LFA-1 protein expression in the five different experimental groups. Parental MDA231Br-GFP (MDA), scrambled shRNA (shS), empty shRNA (shE) and two different clones with significant reduction of LFA-1 expression, KD#1 and KD#2. (B) Quantitation of the mean intensity of each band with respect to the parental MDA231Br-GFP. Band densitometry was normalised to the intensity of tubulin bands and quantified across three independent experiments. Statistical significance was determined by one-way ANOVA, with Tukey post-hoc tests. *p < 0.05 and **p < 0.01. (C) Quantitation of tumour growth in animals injected intrastriatally with parental MDA231Br-GFP cells (MDA), control knockdown cells (empty cassette, shE; and scramble cassette, shS) or LFA-1 knockdown cells (KD#1 and KD#2) (n = 5 per group). Growth is expressed as tumour area/μm2 brain area analysed. Statistical significance determined by one-way ANOVA, with Tukey post-hoc tests. *p < 0.05 and **p < 0.01. (D) Quantitation of rostro-caudal tumour growth through the striatum in the same animals as for (C). Statistical significance determined by one-way ANOVA, with Tukey post-hoc tests. *p < 0.05, **p < 0.01. (E–F) Representative photomicrographs of brain sections from animals injected intracerebrally with parental MDA231Br-GFP (MDA, E) or KD#1 (F) cells; sections stained with cresyl violet and tumour foci are circumscribed in green. Inset shows higher magnification of the tumour colonies in boxed regions.
