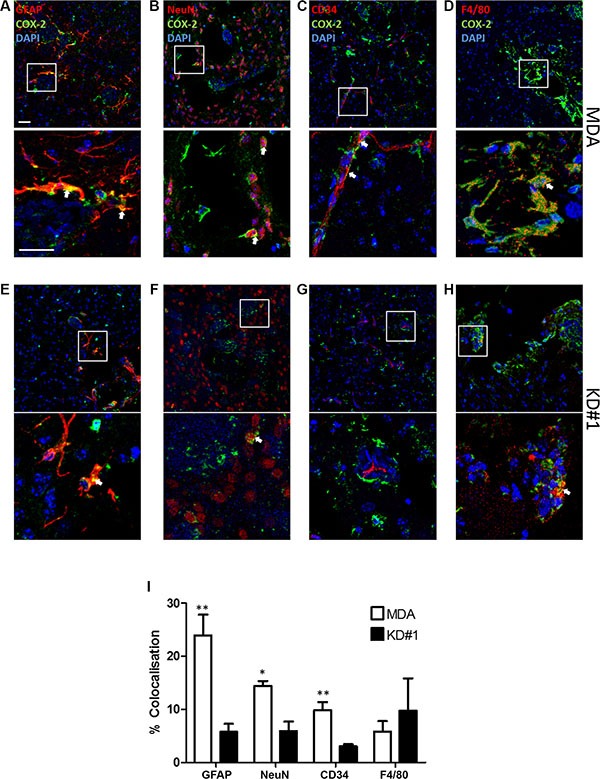
Figure 5. Immunofluorescent images of brain sections from animals injected with either MDA231Br-GFP (MDA) or LFA-1 knockdown (KD#1) cells showing COX-2 (green) co-localisation (arrows) with different brain cell populations in red: (A, E) astrocytes, GFAP; (B, F) neurons, NeuN; (C, G) vessels, CD34; and (D, H) macrophages/microglia, F4/80.

Cell nuclei are stained with DAPI (blue). Scale bars = 100 μm (I) Quantitative analysis of COX-2 co-localisation with different brain cell populations in animals injected with either MDA231Br-GFP (MDA; white bars) or LFA-1 knockdown (KD#1; black bars) cells (n = 4). Statistical significance determined by one-way ANOVA, with Tukey post-hoc tests. **p < 0.01, ***p < 0.005.
