Figure 6.

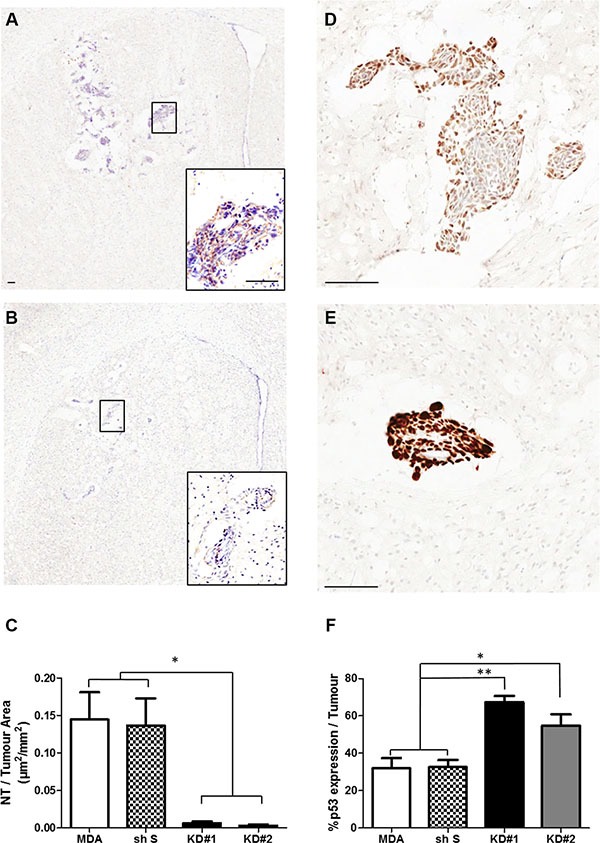
(A–B) Photomicrographs of brain sections showing NT staining within the striatum from a representative animal in each group: MDA (A) and KD#1 (B). Scale bars = 100 μm. (C) Quantitative analysis of the area of nitrotyrosine (NT) staining per mm2 tumour area in animals injected with MDA231BR-GFP cells (MDA), control knockdown cells (sh S), or LFA-1 knockdown cells (KD#1 and KD#2) at day 14 after intracerebral injection (n = 4). Statistical significance determined by one-way ANOVA, with Tukey post-hoc tests; *p < 0.05. (D–E) Photomicrographs of brain sections showing p53 staining within the striatum from a representative animal in each group: MDA (D) and KD#1 (E). Scale bars = 100 μm. (F) Quantitative analysis of p53 expression within the tumour area in animals injected with MDA231Br-GFP cells (MDA), control knockdown cells (shS), or LFA-1 knockdown cells (KD#1 and KD#2) at day 14 after intracerebral injection (n = 4). Statistical significance determined by one-way ANOVA, with Tukey post-hoc tests: *p < 0.05 and **p < 0.01.
