
Figure 4. Effect of SREBP inhibition on lipid metabolism.
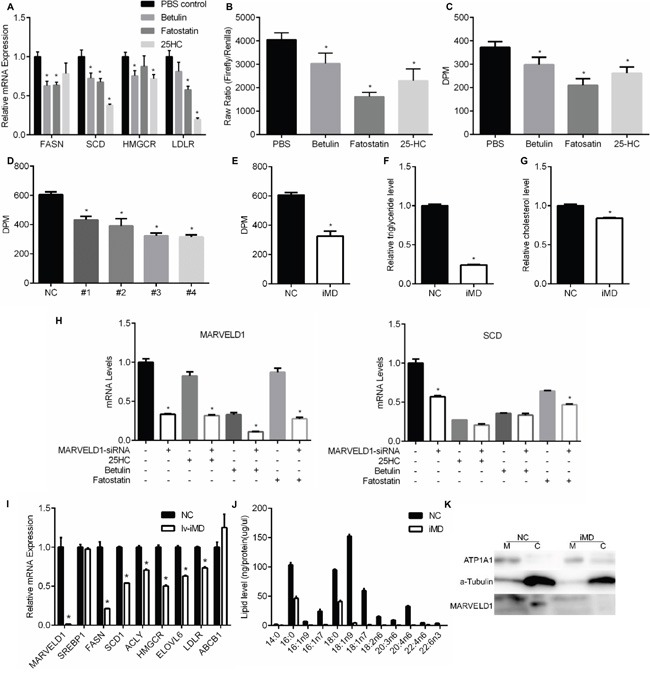
A. qRT-PCR was used to analyze the effects of SREBP inhibiors on the mRNA levels of indicated genes in A549 cells. B. Dual Luciferase assays were used to examine the effects of SREBP inhibitors on SREBP transcription activity in A549 cells. C. Effects of SREBP inhibitors on de novo lipogenesis. Incorporation of [U-14C] glucose into the lipid fraction was measured in the A549 cells treated with SREBP inhibitors. D. Incorporation of [U-14C] glucose into the lipid fraction was measured in the A549 cells transfected with SREBP-siRNAs or siRNA-NC as control. E. Incorporation of [U-14C] glucose into the lipid fraction was measured in the A549 cells transfected with MARVELD1-siRNAs or siRNA-NC as control. F. Influence of MARVELD1 knockdown on intracellular triglyceride level. G. Influence of MARVELD1 knockdown on intracellular cholesterol level. H. qRT-PCR was used to analyze the effects of siRNA-MARVELD1 (or siRNA-NC as the control) on the mRNA levels of indicated genes in the presence of SREBP inhibitors (or PBS as the control) in A549 cells. I. Interference of MARVELD1 by lentivirus markedly reduced the SREBP target genes mRNA levels but had no influence on SREBP and non-SREBP-target gene ABCB1. J. Membrane lipid metabolites of A549 cells in (I) were analyzed by gas chromatography-mass spectrometer (GC-MS) and normalized by total protein levels. K. Western blot of membrane and cytosolic fractions of A549 cells in (J). MARVELD1 is detectable in cytosolic (C) fractions of NC group. ATP1A1 was used as the membrane marker, a-Tubulin as cytosolic marker to exclude contamination during cell fraction isolation. Data are means ± SD (n = 3). *P < 0.05.