Fig. 1.
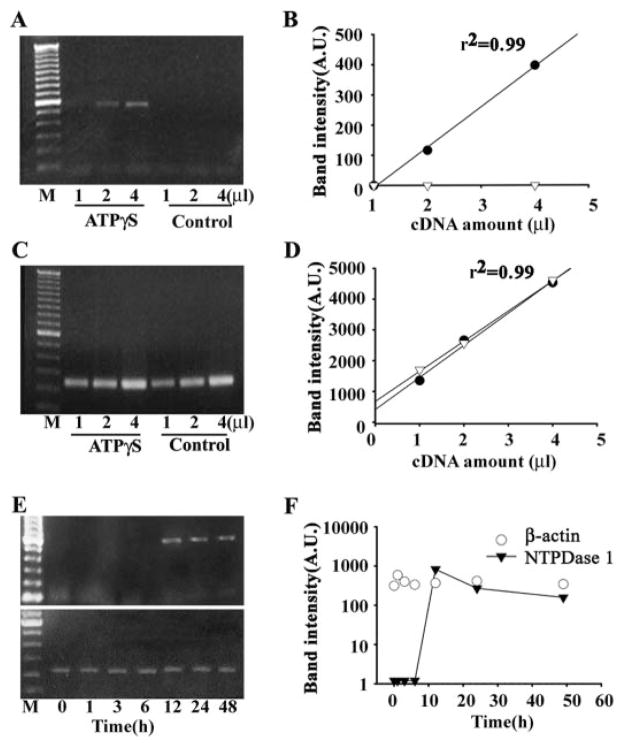
RT-PCR for NTPDase1 from human ARPE-19 cells. A, PCR with a primer pair specific for NTPDase1 generated a 558-bp band in cDNA from cells treated with ATPγS for 48 h but not in untreated control cells. The band intensity increased with the starting volume of cDNA. B, densitometric values of the RT-PCR amplified NTPDase1 products increased linearly with an increasing amount of cDNA in cells exposed to 100 μM ATPγS (black circles). No product was detected from cells in control medium (white triangles). A first order linear regression is fit to the data. Similar increases in NTPDase1 message were found in three independent sets of cells exposed to ATPγS for 48 h, and in all cases, densitometric values increased with the amount of cDNA. C, PCR with β-actin primer pair generated single 244-bp bands in both control and ATPγS-treated cells. D, densitometric values of β-actin products increased linearly in both ATPγS-treated (black circles) and control cells (white triangles). Data are fit with a single order regression. E and F, time course of up-regulation of NTPDase1 mRNA. Cells were exposed to ATPγS continuously for the time indicated. Message for NTPDase1 was first detected after 12-h exposure to ATPγS, whereas levels of β-actin remained constant throughout. NTPDase1 data points are connected with a line. A similar time course was found in three independent trials.

