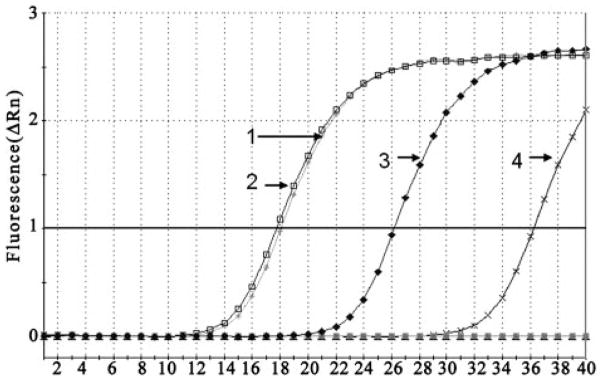
Fig. 2.
Quantitative PCR analysis of NTPDase1 expression in RPE cells. Amplification of NTPDase1 in RPE cells exposed to control or 100 μM ATPγS medium for 48 h was performed with SYBR Green real-time PCR. cDNA samples were diluted 1/10, and all reactions were performed in triplicate. The CT of housekeeping gene β-actin was similar for both control and ATPγS-treated cells (lines 1 and 2, respectively), whereas CT for the NTPDase1 message was attained after considerably fewer amplification cycles in ATPγS-treated cells (line 3) compared with untreated cells (line 4). No signal was detected from the no-template control (bottom line). Similar increases were found using message from three independent trials, each performed in triplicate. The figure indicates the mean of such triplicate reactions from one particular trial.

