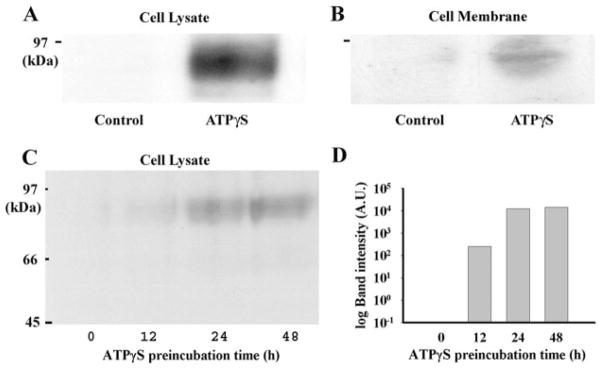
Fig. 3.
Western blot analysis for NTPDase1 protein levels. A, immunoblotting with antibody BU61 demonstrates that incubation of cells with 100 μM ATPγS for 48 h led to detectable 78-kDa bands in protein from whole-cell lysates. B, bands (78 kDa) were also detected in protein purified from cell membranes after incubation with 100 μM ATPγS for 48 h. C, incubation of cells with 100 μM ATPγS for 12, 24, and 48 h led to detectable 78-kDa bands on immunoblots of increasing intensity from cell lysate material. D, quantification of staining intensity indicates that the largest increase in NTPDase1 protein occurred after 12 to 24 h of exposure to ATPγS. A similar increase in NTPDase1 protein levels after 24 h in ATPγS was found in 14 trials.

