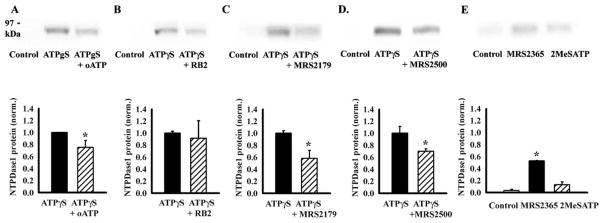
Fig. 5.
Involvement of P2Y1 receptors in up-regulation of NTPDase1. P2 antagonists were given to cells 10 min before 100 μM ATPγS, and the 78-kDa band was detected with antibody BU61 from protein extracted from whole-cell lysates 24 h later. A, nonspecific P2 antagonist oATP (100 μM) decreased the net up-regulation of NTPDase1 by 25%. The upper trace is representative of four independent trials, with the mean ± S.E. given in the bars below. B, effect of RB2 (50 μM) was variable with some trials like that illustrated above indicating a drastic reduction, although the mean decrease was not significant (n = 8). C, P2Y1 receptor antagonist MRS2179 (100 μM) led to a clear decrease in band intensity (n = 7). D, a second P2Y1 antagonist, MRS2500 (10 nM), also decreased band intensity (n = 4). E, P2Y1 agonist MRS2365 (100 nM) significantly increased NTPDase1 levels compared with control after 24-h exposure, whereas the rise with 100 μM 2MeSATP was not significant (n = 2–3). *, p < 0.05 versus ATPγS alone (A–D) or versus control (E).

