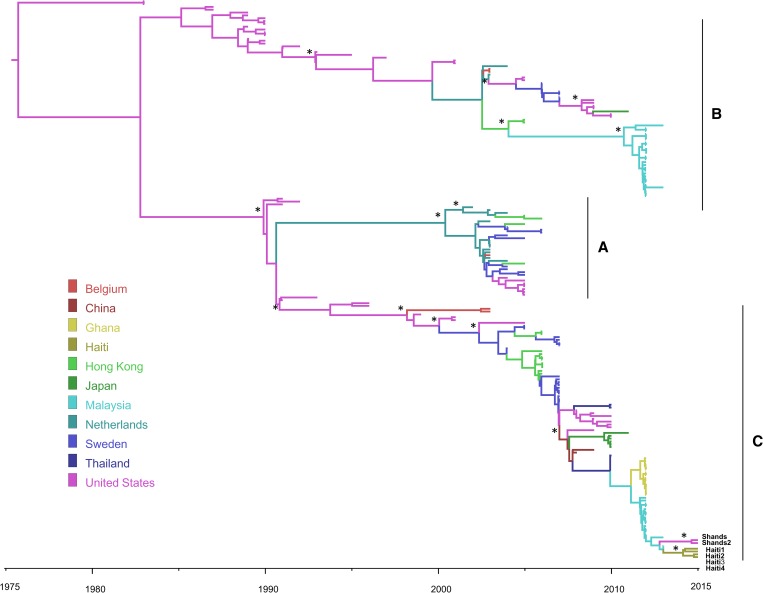
Figure 2.
Maximum Clade Credibility tree of HCoV-NL63 spike gene region. Branches are colored according to the legend to the left where each color represents the geographic location of the sampled sequence (tip branches), as well as of the ancestral lineage (internal branches) inferred by Bayesian phylogeography. The tree was scaled in time by enforcing a relaxed molecular clock (see Supplemental Information). One asterisk along the branch represents significant statistical support (posterior probability ≥ 90%). Sequence labels for the new strains are shown.

