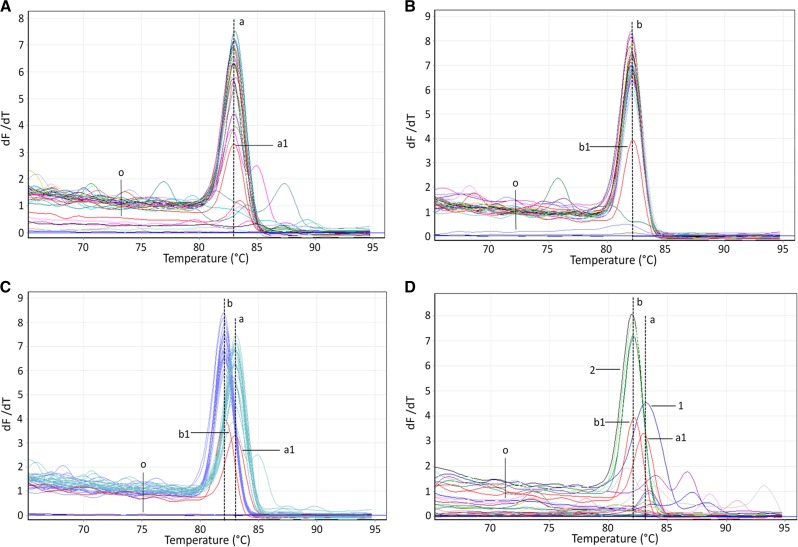
Figure 2.
Testing of 50 clinical stool specimens using the combined polymerase chain reaction assay. The vertical (a) and (b) dashed lines show the consensus Tm peak values used to identify Opisthorchis viverrini (83.11 [±0.12]) and Haplorchis taichui (82.09 [±0.06]). (a1) and (b1) represent the detection limits of the O. viverrini and H. taichui COI gene plasmids, respectively. The letter O indicates the other templates that were not amplified by the two specific primers, including the negative control (no DNA template). In total, (A) 24 consensus Tm peaks were identified as O. viverrini, (B) 31 consensus Tm peaks were identified as H. taichui, and (C) 21 consensus O. viverrini Tm peaks and 21 consensus H. taichui Tm peaks were detected in the coinfected specimens. Furthermore, (D) 16 consensus Tm peaks were amplified by the O. viverrini– or H. taichui–specific primers in samples that were found to be negative for “Opisthorchis-like” eggs during microscopic examinations. Figures 2D-1 and 2D-2 show the amplification curves and Tm peak values for the samples in which O. viverrini (sample no. 35 in Table 3) and H. taichui (sample nos. 35, 36, 37, and 40 in Table 3) were detected, respectively.

