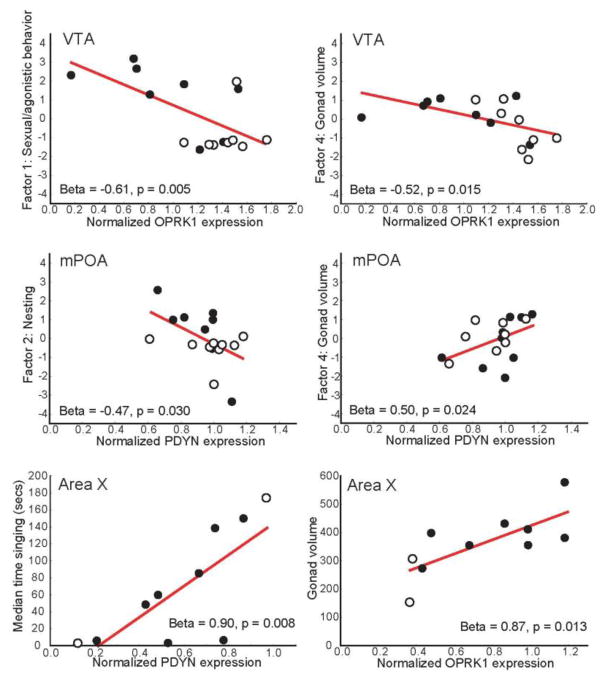
Figure 4.
Scatterplots showing relationships between OPRK1 and PDYN expression in VTA and mPOA and principal components; and between expression in Area X and median time singing and gonad volume. Each point represents data for an individual male. Filled points indicate males with nest sites; open points indicate males without nest sites. Regression line indicates p < 0.05.

