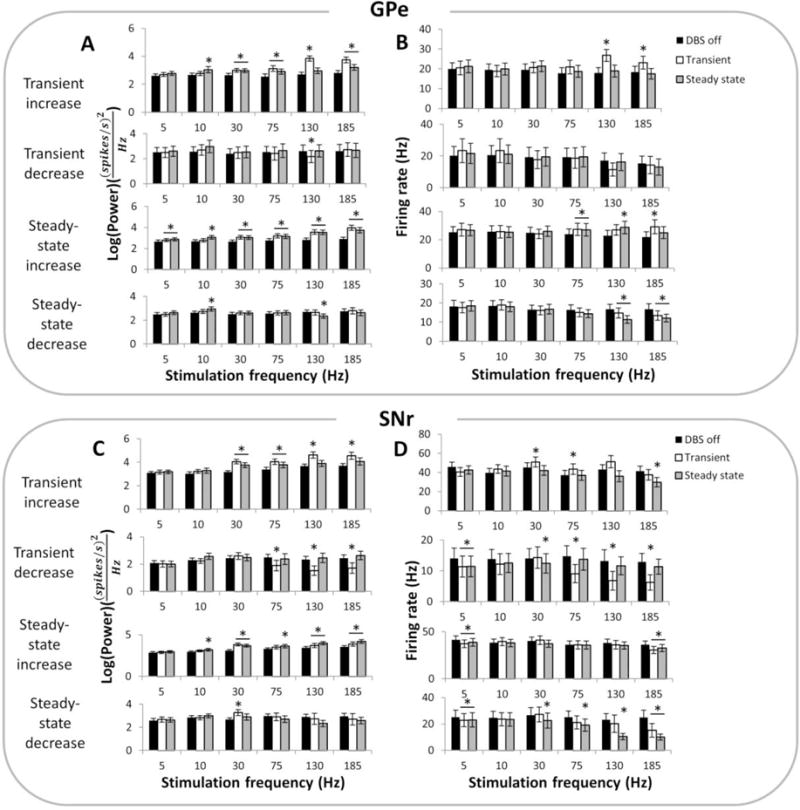
Figure 4.

(A) Quantification of changes in oscillatory power in the GPe at the stimulation frequency during DBS off, during the transient phase after onset of DBS or and during the steady-state phase of DBS, at different frequencies of stimulation. Oscillatory power was quantified for subsets of single units in the GPe that exhibited transient increase (n=21), transient decrease (n=9), steady-state increase (n=35) or steady-state decrease (n=23) in oscillatory power during 130 Hz DBS (B) Quantification of changes in firing rates in the same subset of GPe neurons as in (A) during different frequencies of DBS. (C) Quantification of changes in oscillatory power in the SNr at the stimulation frequency during DBS off, transient DBS or steady-state DBS, at various frequencies of stimulation. Oscillatory power was quantified for subsets of single units in the SNr that exhibited transient increase (n=16), transient decrease (n=11), steady-state increase (n=35) or steady-state decrease (n=15) in oscillatory power during 130 Hz DBS. (D) Quantification of changes in firing rates in the same subset of SNr neurons as in (C) during different frequencies of DBS. (*) indicates a significant difference from DBS off (p < 0.05, one-way repeated measures ANOVA and post-hoc Fisher’s PLSD).
