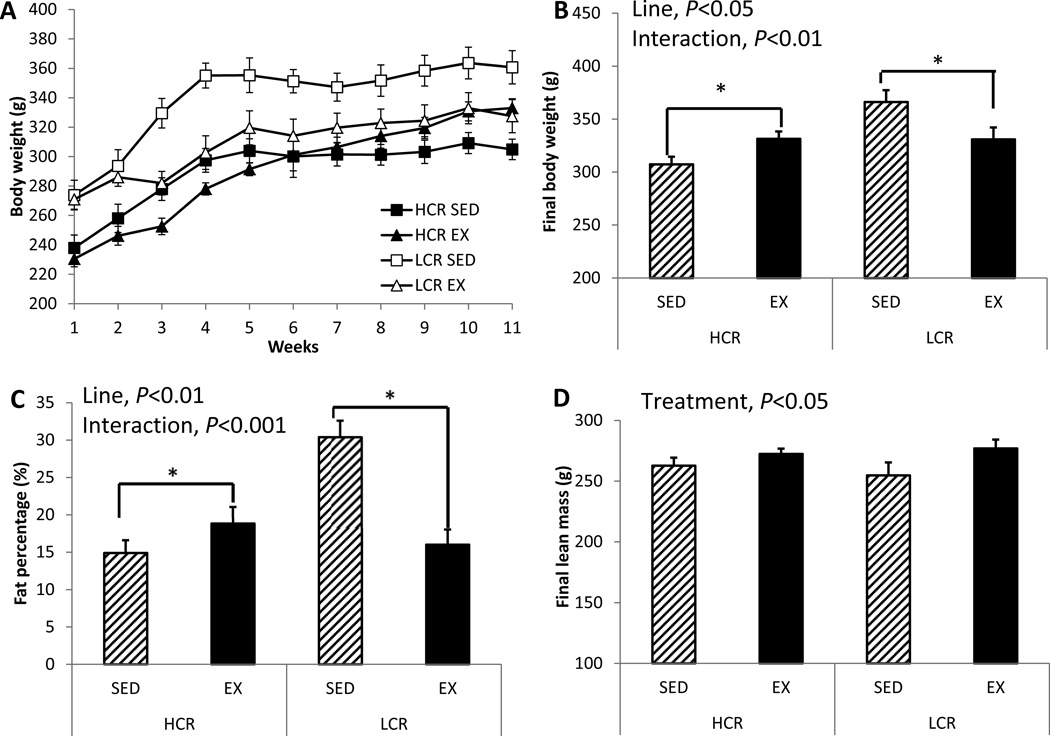
Figure 1. EX decreases fat mass in LCR but increases in HCR.
(A) Body weight gain curves for 11 weeks, (B) final body weight, (C) % body fat, and (D) final lean mass. Values are means ± SE (n=7–8 per group). Line = line main effect, HCR vs. LCR; Treatment = treatment main effect, SED vs. EX; Interaction = line × treatment interaction. * Denotes difference (P<0.05) between SED and EX within line.

