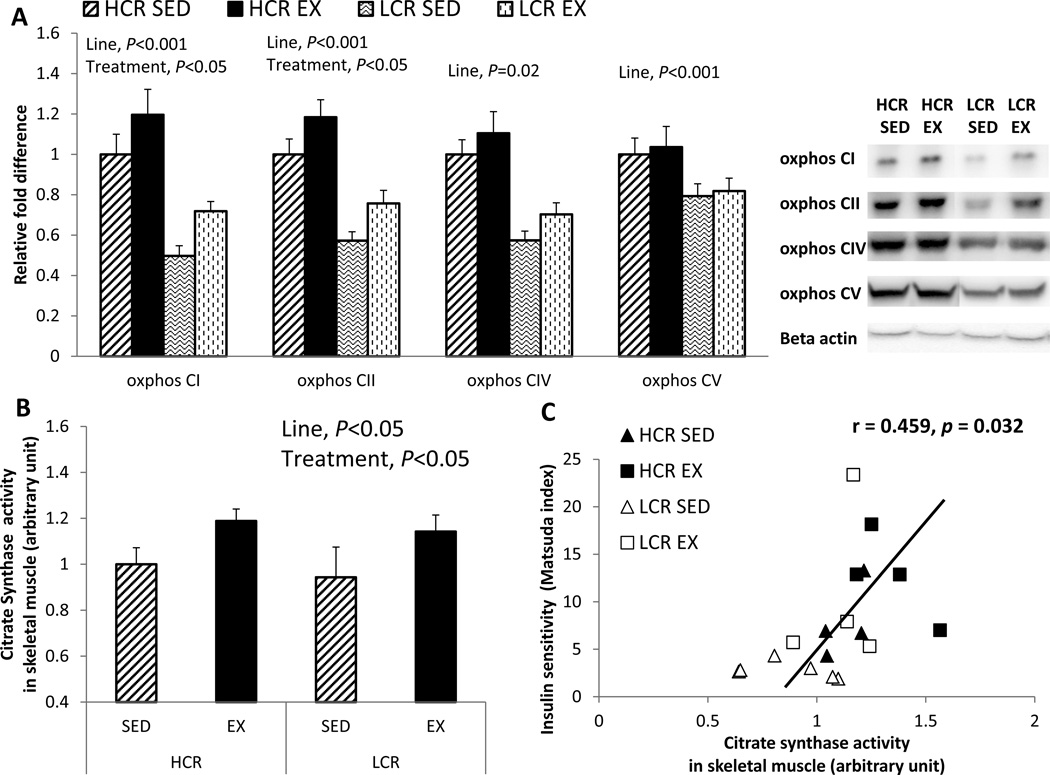
Figure 5. EX increases skeletal muscle mitochondrial content in both lines.
(A) oxidative phosphorylation (OX PHOS) complex I, II, IV, and V proteins in skeletal muscle; (B) skeletal muscle citrate synthase (CS) enzyme activity; and (C) association between citrate synthase activity and insulin sensity(i.e. Matsuda index). Values are means ± SE (n=6–8 per group). Line = line main effect, HCR vs. LCR; Treatment = treatment main effect, SED vs. EX.

