
FIGURE 2.
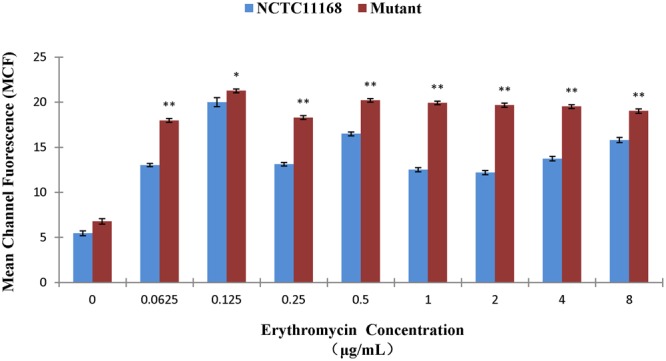
Mean values of PI stain of ΦCj1199 and NCTC11168 cultured with different concentrations of erythromycin. The asterisk (∗) and (∗∗) represent statistical significant difference with P ≤ 0.05 and P ≤ 0.01 comparing with C. jejuni NCTC11168, respectively.