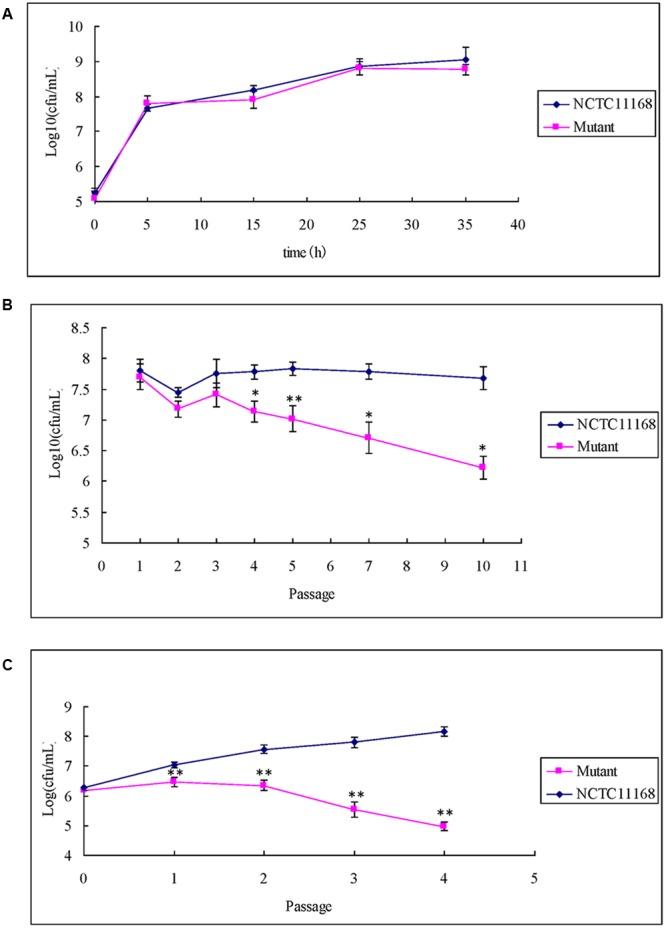
FIGURE 3.

Single growth curve and competitive growth of ΦCj1199 and NCTC11168 in the culture with or without erythromycin. (A) Bacterial culture grown in MH for 36 h. Viable colonies were determined at 5, 15, 25, and 35 h. (B,C) Pair-wise competition of C. jejuni NCTC11168 and mutant was determined during 5–10 passages in the mixed culture. The Initial and final concentrations were determined by standard plate count on MH or MH with chloromycetin. The asterisk (∗) and (∗∗) represent statistical significant difference with P ≤ 0.05 and P ≤ 0.01 comparing with C. jejuni NCTC11168, respectively.
