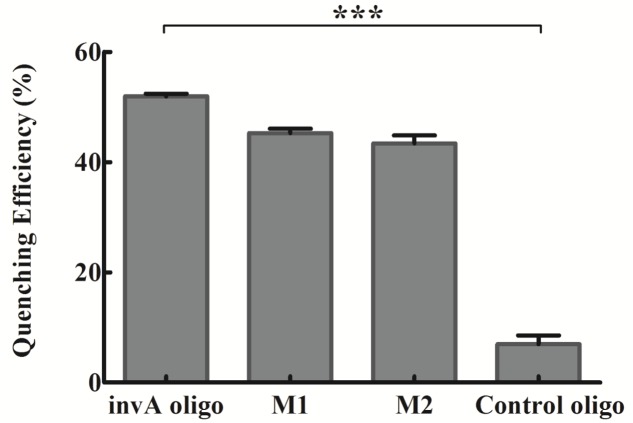
FIGURE 5.
The specificity of the developed invA gene biosensor. The concentrations of invA oligo (fully complementary to probes), M1 (one-base mismatch), M2 (two-base mismatch) and control oligo (not complementary to neither probes) used were fixed at 400 nM. The SEM (Standard Error of the Mean) error bars were calculated from at least three replicates. The difference between invA oligo and control oligo groups was significant (P < 0.0001, two tail t-test), but the difference between invA oligo and M1 or M2 groups were not significant (P > 0.05, two tail t-test). The data was analyzed by GraphPad Prism. ∗∗∗P < 0.0001.

