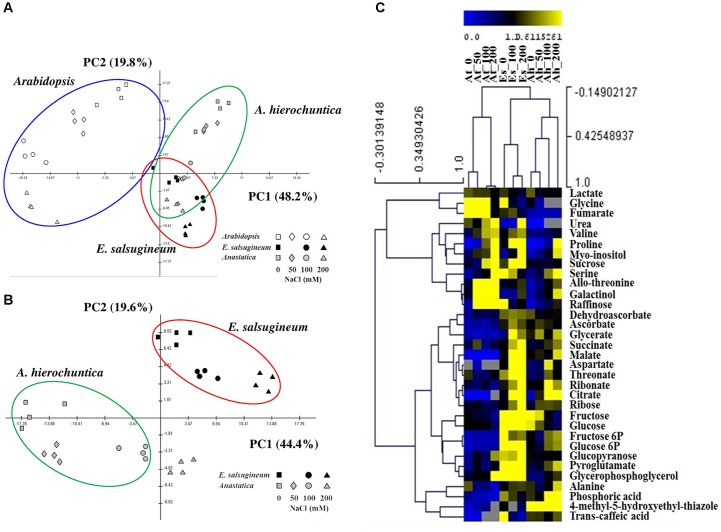
FIGURE 6.
Principal component analyses (PCA) and hierarchical clustering of metabolic profiles of Arabidopsis (At), A. hierochuntica (Ah) and E. salsugineum (Es) under control and salt stress conditions. For PCA, metabolite relative abundance was first normalized using log10 transformation and then analyzed statistically using MultiExperiment Viewer Version 3.1 software (Saeed et al., 2003). The variance explained by each component is indicated in brackets. (A) PCA comparing all three species. (B) PCA comparing E. salsugineum and A. hierochuntica. (C) Hierarchical clustering (HCA) of all three species. For HCA, averages of absolute values (n = 4) for each metabolite normalized by the ribitol standard were divided by the median normalized metabolite abundance and are presented as a heat map. For both analyses, data are representative of similar results from two independent experiments.

