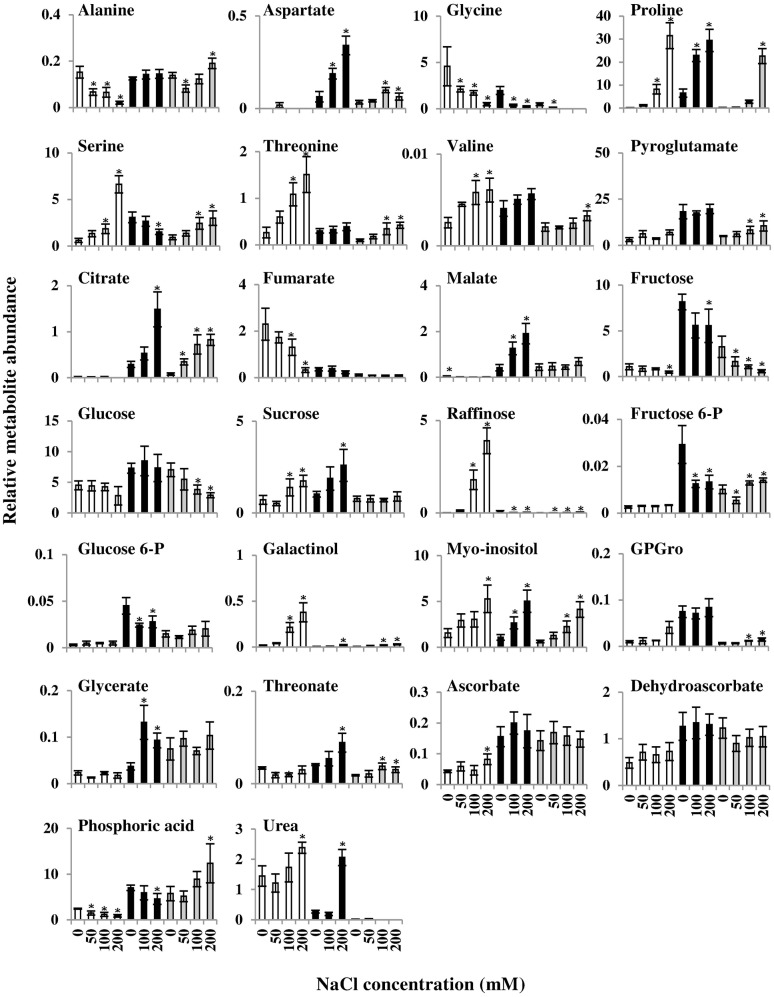
FIGURE 8.
Comparison of Arabidopsis (white bars), E. salsugineum (black bars), and A. hierochuntica (gray bars) metabolic responses to salt stress. Data are mean (n = 4) ± SD, and are representative of two independent experiments. Asterisks represent significant difference (P < 0.05, Dunnett test) between Arabidopsis, E. salsugineum or A. hierochuntica and their respective controls. GPGro, glycerophosphoglycerol.

