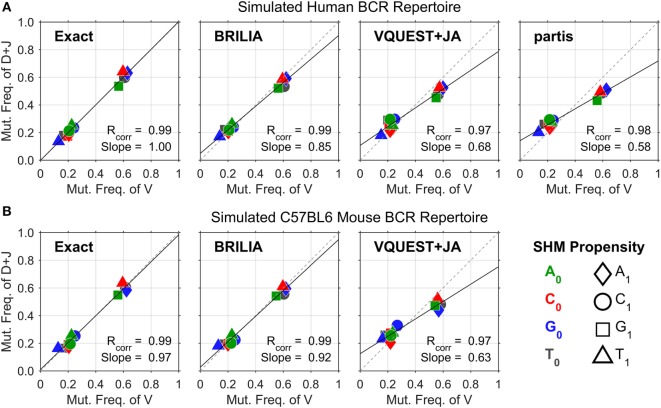
Figure 2.
Somatic hypermutation (SHM) propensity correlations between the V and DJ segments for simulated (A) human and (B) mouse B-cell receptor sequences. The combination of color and shape of a data point represents a SHM propensity or the mutation frequency of nucleotide (nt) X0 to nt X1. The x- and y axes show the normalized mutation frequencies (e.g., PA➔T + PA➔C + PA➔G = 1) for the V and DJ segments, respectively. Rcorr is the Pearson correlation coefficient, while Slope is the slope of the linear regression line.

