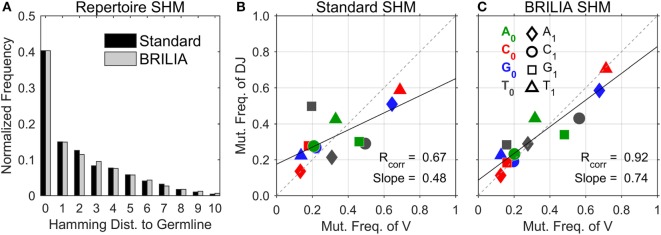
Figure 3.
Comparison of somatic hypermutation (SHM) identification in real-life C57BL/6 B-cell receptor repertoires between the standard method and BRILIA. (A) Frequency distribution of SHMs per sequence predicted for all sequences in relation to their corresponding cluster’s germline sequence. (B) SHM propensity correlation returned by the standard method. Note that SHMs were determined for parent–child sequence pairs and not germline–child sequence pairs. (C) SHM propensity correlation returned by BRILIA.

