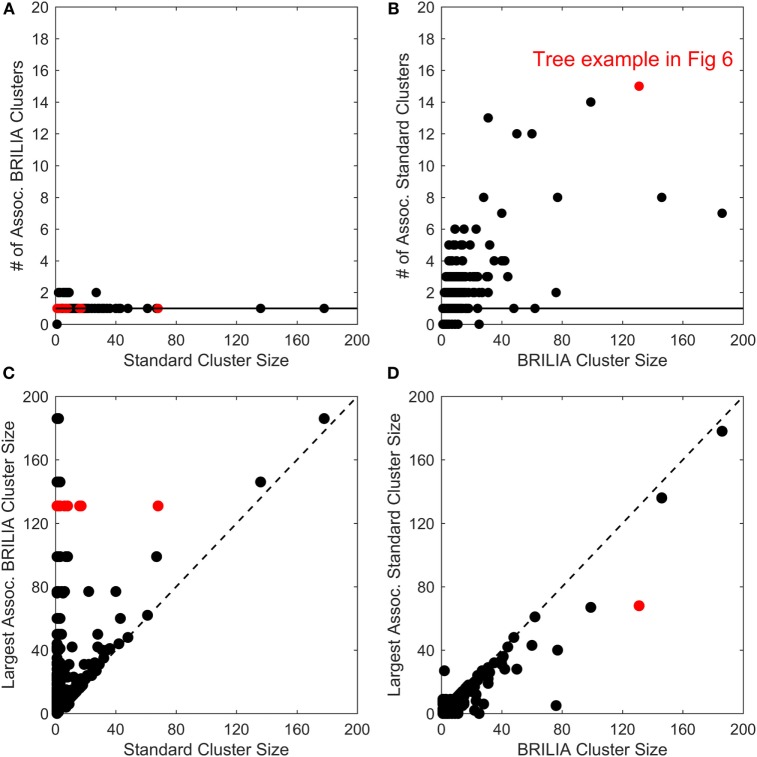
Figure 5.
Comparison of cluster counts and sizes between annotations made using the standard method and BRILIA. (A) Number of BRILIA clusters that are associated (Assoc.) with each standard cluster, where associated clusters share at least one B-cell receptor sequence. The red dots represent clusters whose corresponding lineage trees are shown in Figure 6. (B) Number of standard clusters that are associated with each BRILIA cluster. (C) Largest BRILIA cluster size associated with each standard cluster. The dotted diagonal line (y = x) highlights differences in the associated cluster sizes between the two methods. (D) Largest standard cluster size associated with each BRILIA cluster.

