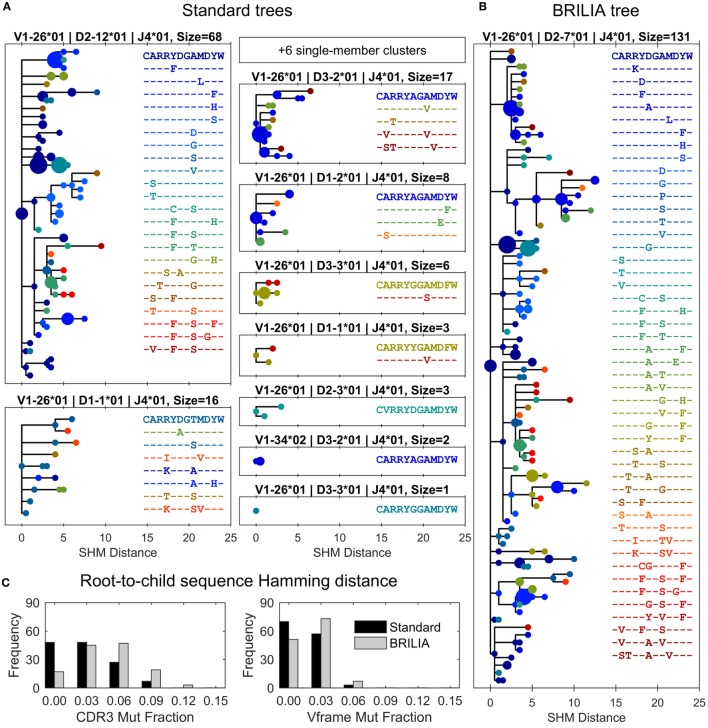
Figure 6.
Differences in lineage trees and somatic hypermutation (SHM) frequencies between the associated standard and BRILIA clusters from the example in Figure 5. (A) Lineage trees are assembled from standard clusters that are subsets of a larger associated BRILIA cluster. The x-axis shows the absolute SHM distance, where the difference in SHM values between parent and child sequence is the SHM distance between the two sequences. Each dot color corresponds to a unique CDR3 sequence, and the dot size is scaled proportional to the sequence template count relative to the total template count within each lineage tree. The SHM distance is calculated based on the comparison of two 125-nucleotide sequences. Note that six single-member clusters are not drawn. (B) Lineage tree of a large BRILIA cluster that encompasses standard clusters. (C) Mutation frequencies of the V gene framework and CDR3 predicted by the two methods.

