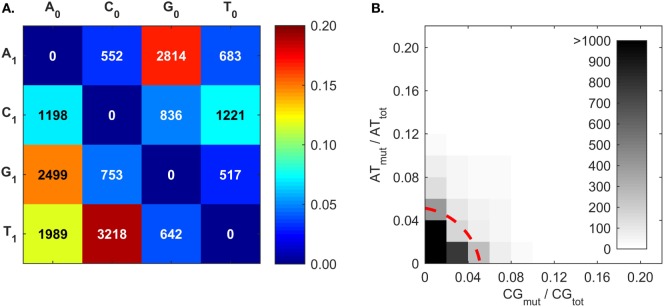
Figure 7.
Somatic hypermutation (SHM) frequencies returned by BRILIA, for the purpose of evaluating SHM mechanistic models. (A) Cumulative frequency of SHM propensities for VDJ segments, excluding N regions. X0 is the parent nt and X1 is the child nucleotide. (B) The [A ➔ G + T ➔ C] mutation frequency (ATmut) normalized by the total A + T content (ATtot), plotted against the [C ➔ T + G ➔ A] mutation frequency (CGmut) normalized by the total C + G content in the VDJ segments (CGtot). The dotted red line, which depicts a circle with its center at the origin and a radius of 0.06, marks the mutation rate that captures 90% of the mutated sequences.

