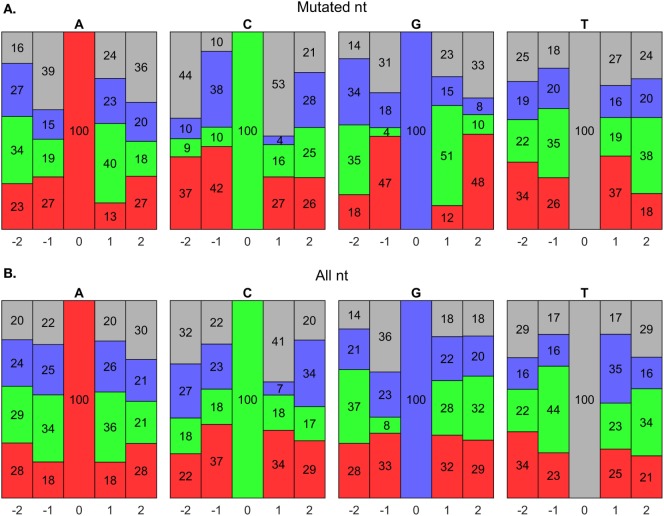
Figure 8.
Somatic hypermutation (SHM) hot spot analysis using BRILIA annotations. (A) Evaluation of nucleotide (nt) compositions near only mutated nts, which are at the 0 positions. The negative and positive positions are nts toward the 5′ and 3′ sides, respectively, of the 0 position nt. The nt color codes are A = red, C = green, G = blue, and T = gray. (B) Evaluation of nt compositions of all nts, regardless of whether they mutated.

