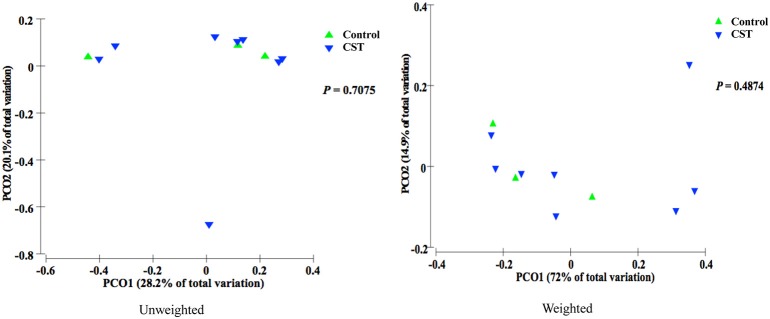
Figure 2.
PCoA based on the unweighted and weighted UniFrac distance metric. Each colored point represents a colonic mucosa-associated sample obtained from one mice and it is colored according to different treatment (CST or Control). P-values were calculated using PERMANOVA. Samples did not cluster according to treatment status of the mice (P > 0.05).

