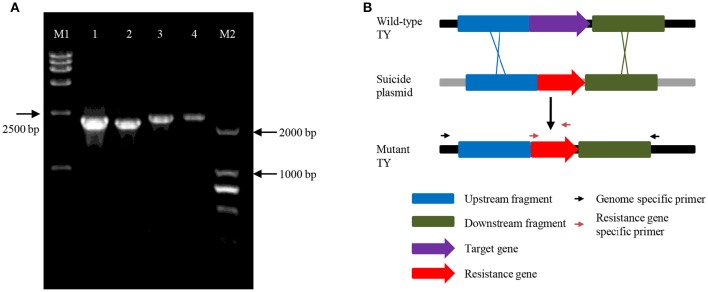
Figure 3.
PCR verification of TYΔndrA1 and TYΔndrB2 using specific primers beyond the homologous fragments and primers in the resistance gene. (A) Sample 1, amplified with ndrA1-VF and Kan02, 2260 bp; sample 2, amplified with ndrA1-VR and Kan01, 2172 bp; sample 3, amplified with ndrB2-VF and Kan01, 2308 bp; sample 4, amplified with ndrB2-VR and Kan02, 2330 bp; M1, DL15000 marker; M2, DL2000 marker. Electrophoresis was performed using 0.8% agarose; (B) The in-frame deletion of target genes, and relative site of genomic-specific primers and resistance gene-specific primers.

