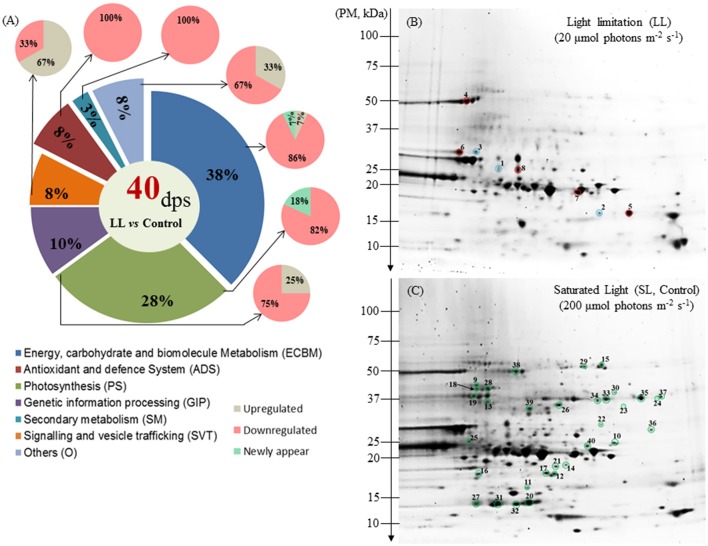
Figure 3.
Protein distribution and profiling of Zostera muelleri exposed to light stress. (A) Functional group classification of differentially expressed proteins. (B) Representative 2-DE (pI range 3–10, n = 3) of the leaf proteome exposed to limited light (LL; 20 μmol photons m−2s−1), (C) saturating light (SL, Control; 200 μmol photons m−2s−1) irradiance conditions. Spots circled in red, blue and green represent up-regulated, newly appeared and down-regulated proteins. Gels were stained with Coomassie Blue G-250. Dps, differential protein spots; PM, protein marker.

