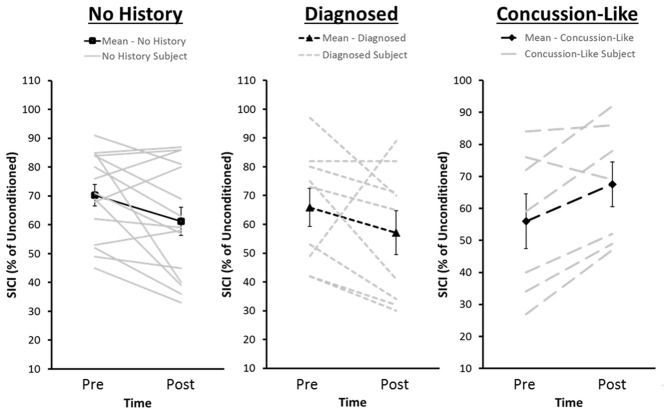
Figure 4.
Distribution of pre- and post-iTBS values of SICI for each of the No History group and the Diagnosed and Concussion-Like cohorts of the Concussion History group. The dark lines represent group averages from pre- to post-iTBS. The gray lines represent SICI pre- and post-iTBS for each individual within that cohort. SICI is expressed as a percentage of unconditioned MEP amplitude. Error bars represent the standard error of the mean.

