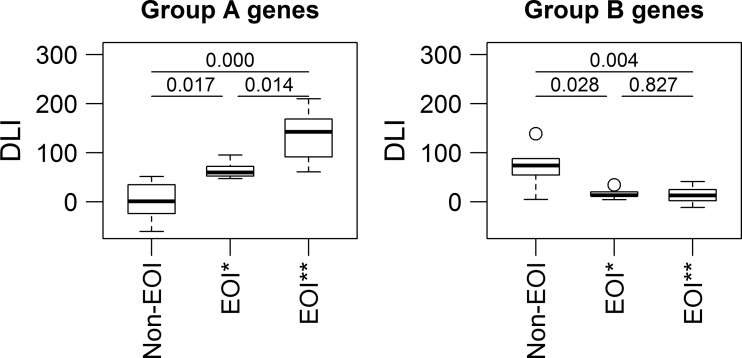
Fig. 3.
Mean DLIs of differentially regulated group A and B genes in preterm infants with and without EOI. Comparison of disease load indices (DLIs) of non-EOI, EOI with low expression of group A genes (EOI*) and EOI with high expression of group A genes (EOI**). Group A genes show significantly higher DLI of group A genes in EOI** compared to EOI* and non-EOI. Group B genes show significantly lower DLI in both EOI* and EOI** compared to non-EOI. The significance of the difference between the DLIs of the patients groups was given as a P value deriving from pairwise Student’s t test with Benjamini-Hochberg correction for group A genes and from non-parametric Kruskal-Wallis test and non-parametric pairwise Wilcoxon ranks sum test with Benjamini-Hochberg correction for group B genes

