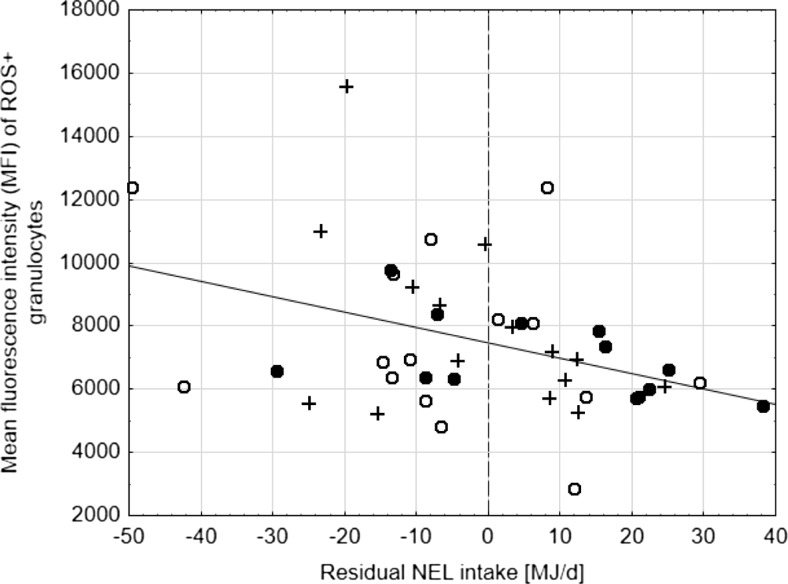
Fig. 1.
Relationship between residual NEL intake and mean fluorescence intensity (MFI) of ROS+ granulocytes: y = 7459–48.8·x, r 2 = 0.148, residual standard deviation = 1435 MFI (p values for regression parameters and r 2 < 0.05); black circle, group CON; white circle, group TOX-1; plus sign, group TOX-2

