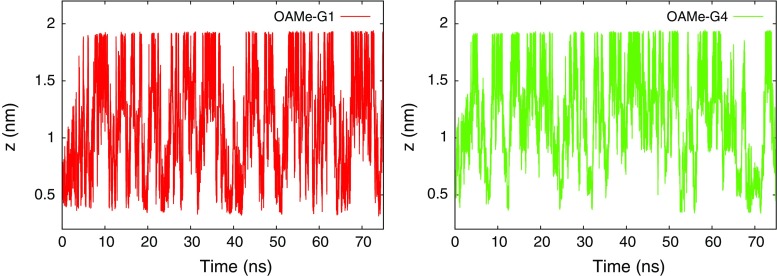
Fig. 4.
Time evolution of CV 1 (projecion of the ligand on the z axis) during the WT–FM simulations of the OAMe–G1 complex (left) and the OAMe–G4 complex (right) using the GAFF force field. The bound state is characterized by –0.6 nm, whereas the unbound state has nm. The results for the other systems resemble the left figure; the OAMe–G4 complex is exceptional in that it shows fewer visits to the bound state

