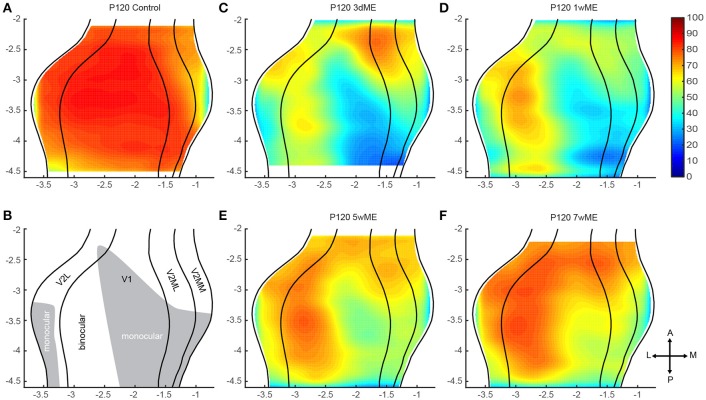
Figure 3.
Top view representation of the relative zif268 expression of the visual cortex of the mouse in (A) adult control animals and after (C–F) 3 days, 1, 5, and 7 weeks of monocular enucleation (ME). (B) Illustration of the delineated visual areal borders for V2L, V1, V2ML, and V2MM (lateral to medial, black lines) based upon the cytoarchitecture (Nissl). Based upon the drop of zif268 expression visible in the map of 1wME mice the monocular (gray area) and binocular zones (white area) within the visual cortex were distinguished. (C–F) A sharp decrease of expression is visible after 3 days of ME with a gradual and partial recovery after 7 weeks of ME. Axes unit in mm.

