Figure 4.
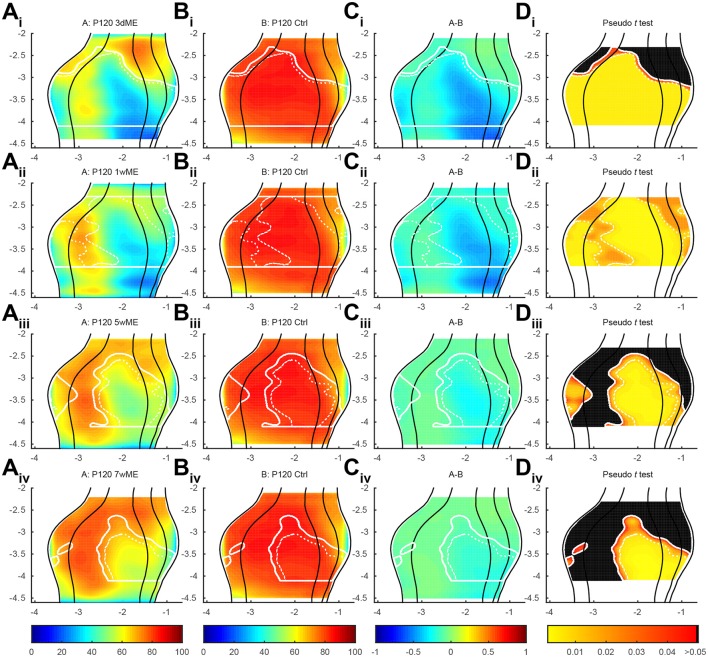
(Ai-iv) Top view representation of the relative zif268 expression of the visual cortex of the mouse for the conditions P120 3d, 1w, 5w, and 7wME (condition A) vs. (Bi-iv) P120 control (condition B) together with their (Ci-iv) relative difference between conditions A and B and (Di-iv) one-tailed deactivation pseudo t -test image. Overlay white solid and dashed contour lines show the boundary where the null hypothesis has been rejected with α = 0.05 and α = 0.01, respectively. ME results in the most pronounced decrease in zif268 expression in the posterior aspect of the visual cortex which recovers over time except for the monocular zone. At 1wME there is a delayed suppression in the most anterior region of the visual cortex, which recovers swiftly. In the extrastriate areas, the initial reduced patch in V2L reactivates almost completely in contrast to the posterior halves of V2ML and V2MM, which do not reach normal values again. In all visual areas the binocular zone is less reduced compared to the monocular zone and recovers fully after 5 weeks through a medial expansion toward the monocular zone of V1 (medial shift of solid white line at monocular-binocular border of V1). Axes unit in mm and orientation as used in previous figures.

