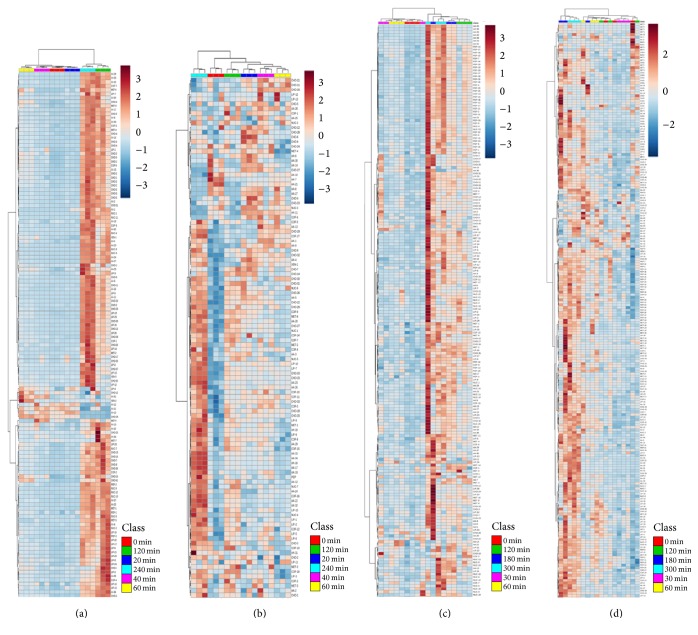
Figure 3.
Heatmap of metabolites in tobacco and soybean leaves and roots at various dehydration time points. Tobacco roots (a) and leaves (b). Soybean roots (c) and leaves (d). In tobacco (a-b), the following colors indicate the dehydration time points: red (control), blue (20 min), pink (40 min), yellow (60 min), green (120 min), and light blue (240 min). In soybeans (c-d), the following colors indicate the dehydration time points: red (control), pink (30 min), yellow (60 min), green (120 min), blue (180 min), and light blue (300 min).

