Figure 6.

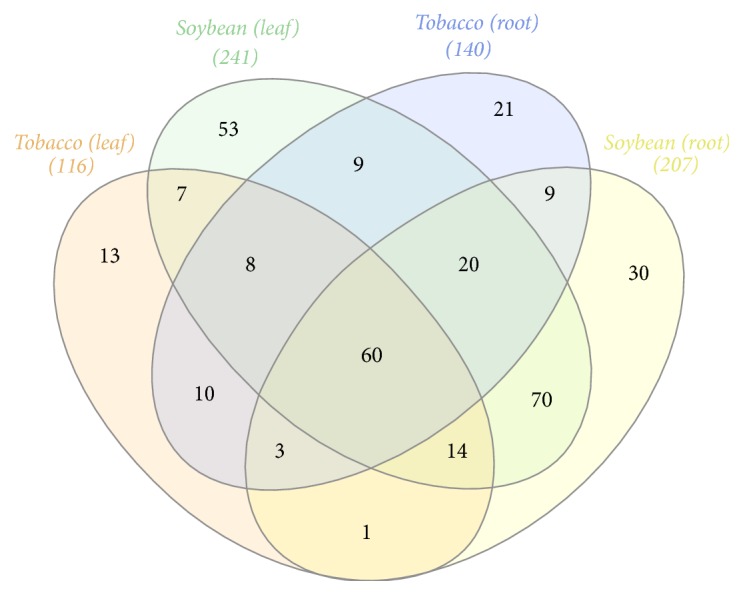
A Venn diagram representing the distribution of metabolites in tobacco and soybean leaves and root samples. Numbers in parenthesis are the total number of metabolites detected in each sample.

A Venn diagram representing the distribution of metabolites in tobacco and soybean leaves and root samples. Numbers in parenthesis are the total number of metabolites detected in each sample.