Figure 3.

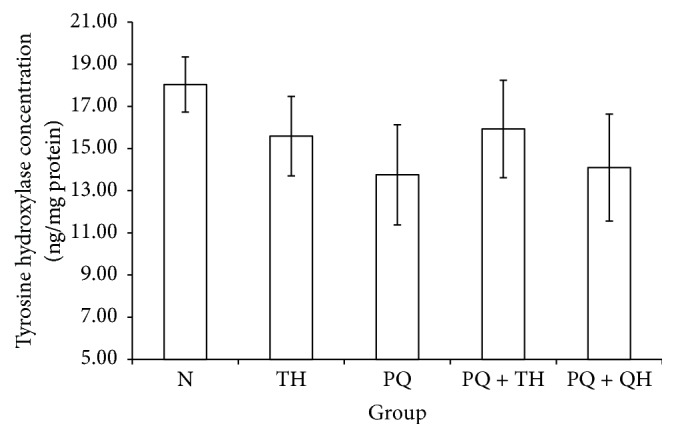
Midbrain concentrations of TyrH for all experimental groups. Data are presented as the mean ± SEM, n = 8 per group. No significant differences (p = 0.637) were observed among all the experimental groups.

Midbrain concentrations of TyrH for all experimental groups. Data are presented as the mean ± SEM, n = 8 per group. No significant differences (p = 0.637) were observed among all the experimental groups.