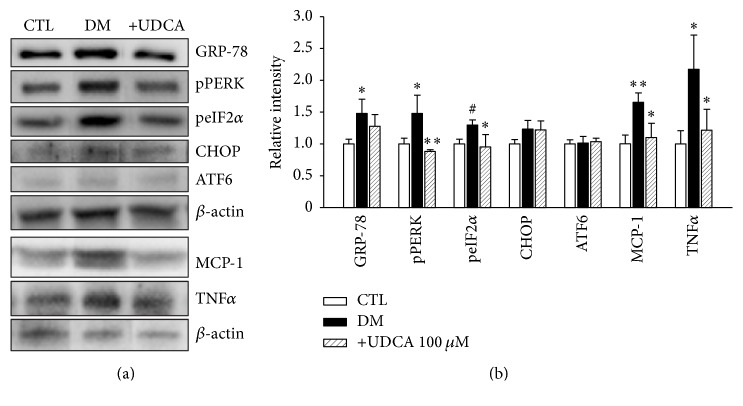
Figure 3.
Induction of UPR and inflammatory cytokines and UDCA-mediated attenuation in diabetic mice. Levels of UPR markers and inflammatory cytokines were assessed via western blot analysis of eye tissue from control (n = 5), nontreated DM (n = 5), and UDCA-treated DM (n = 5) groups. (a) Representative results of western blot analyses are shown. (b) Increased levels of GRP78, pPERK, peIF2α, MCP-1, and TNF α in diabetic mice, compared to the control group, were attenuated by UDCA. ATF6 and CHOP expression was not significantly different among groups. CTL: control mice, DM: nontreated diabetic mice, and +UDCA: diabetic mice treated with UDCA, ∗P < 0.05, ∗∗P < 0.01, #P < 0.005.

