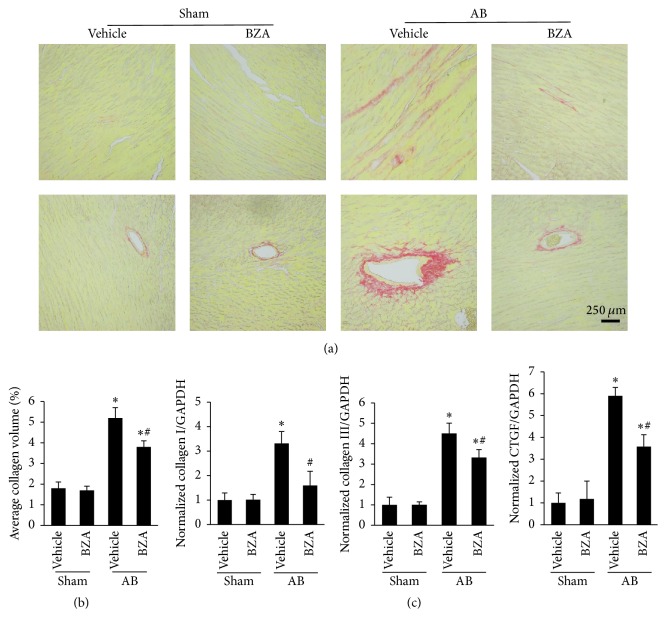
Figure 3.
BZA suppressed cardiac fibrosis in vivo. (a) The histologic manifestation of PSR in both left ventricular and vascular fibrosis (n = 4). (b) The collagen level of the sham and AB groups in the presence and absence of BZA treatment (n = 4). (c) The mRNA level of collagen I, collagen III, and connective tissue growth factor (CTGF) (n = 6).

