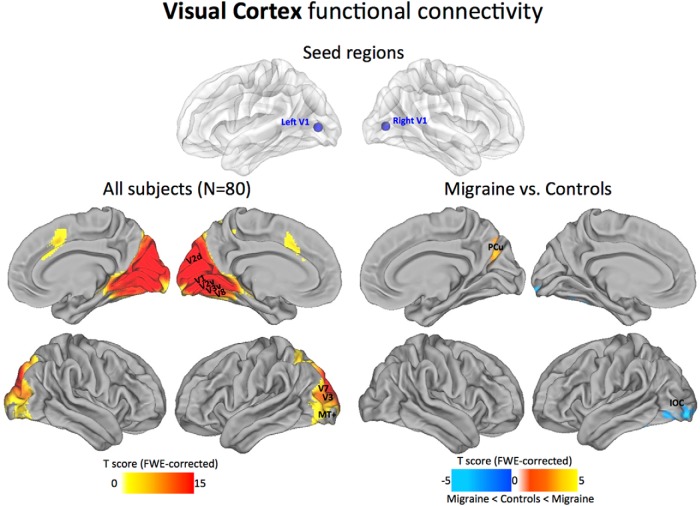
Figure 2.
Visual cortex functional connectivity. The statistical maps illustrate the direct connectivity of the visual cortex across all subjects in the sample (N = 80; left). Groupwise changes in functional connectivity (migraine vs control subjects) are displayed on the right. All statistical images are displayed with a cluster probability threshold of p < 0.05, corrected for multiple comparisons (FWE). Seed regions used to generate the contrasts are projected onto glass brains for reference purposes. Data are shown in Caret PALS space, with multiple views of the left/right hemispheres. V1, V2, V3, V7, V8, MT+, Visuotopic areas.

