
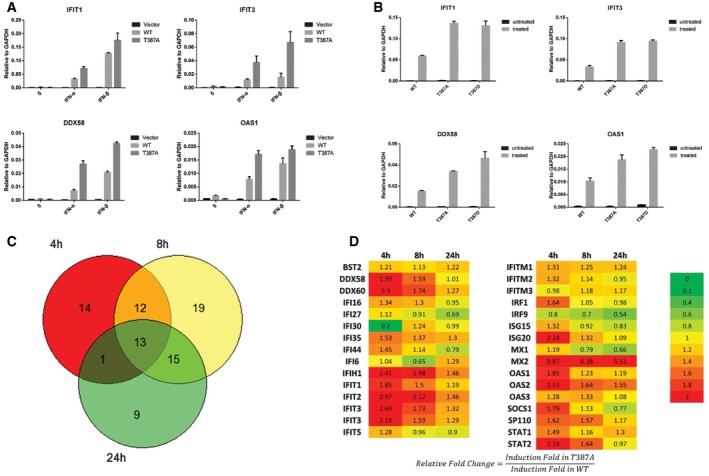
Figure 2. Threonine phosphorylation of T387 STAT2 negatively regulates type I IFN signaling.
-
AU6A cells expressing wild‐type or T387A STAT2 were treated with IFN‐β (100 IU/ml). Cells were harvested after 4 h, and total RNAs were analyzed by real‐time PCR. Values are the means ± SD from three independent experiments.
-
BU6A cells expressing wild‐type, T387A, or T387D STAT2 were treated with IFN‐β (100 IU/ml). Cells were harvested after 4 h, and total RNAs were analyzed by real‐time PCR. Values are the means ± SD from three independent experiments.
-
C, DU6A cells expressing wild‐type or T387A STAT2 were treated with IFN‐β for 0, 4, 8, or 24 h. Total RNAs were analyzed by using an Illumina HumanHT‐12 v4 Expression BeadChip array. The average signal for each probe was used to determine expression levels. Genes with average signals below 25 and detection P‐values > 0.01 in the untreated or treated cells were excluded from the analysis. Inductions of less than twofold were not scored. The Venn diagram shows the numbers of genes induced by 1.2‐fold or more in U6A cells expressing T387A STAT2, relative to untreated control cells. The numbers in the table are fold changes calculated from the ratios T387A STAT2 treated/untreated and wild‐type STAT2 treated/untreated.