
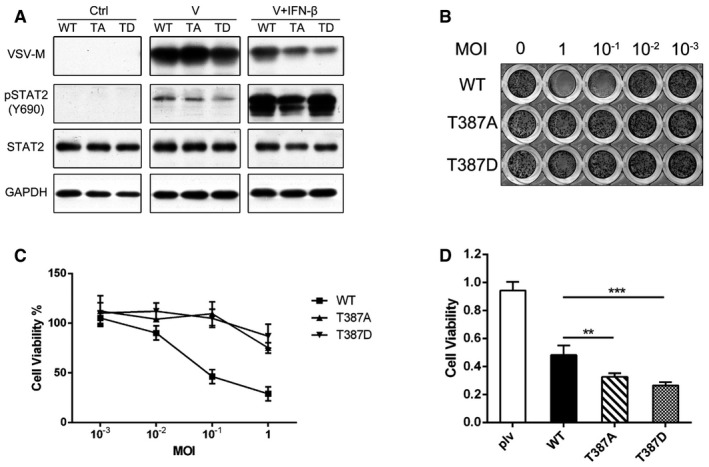
Figure 3. Phosphorylation of T387 of STAT2 inhibits the antiviral and growth suppressive activities of IFN‐β.
-
AHME cells expressing wild‐type, T387A, or T387D STAT2 were seeded in 96‐well plates at 8,000 cells/well. The cells were exposed to vesicular stomatitis virus (VSV) for 2 h, with or without pre‐treatment with IFN‐β (100 IU/ml). After 20 h, the amounts of the VSV‐M and STAT2 proteins were analyzed by Western blot.
-
B, CHME cells expressing wild‐type, T387A, or T387D STAT2 were seeded in 96‐well plates at 8,000 cells/well. On the second day, the cells were treated with IFN‐β (10 IU/ml) for 2 h. The cells were then exposed to different multiplicities of infection of VSV for 2 h, followed by fresh media containing 10 IU/ml of IFN‐β. The cells were analyzed by staining with crystal violet (B) or the MTT assay (C) after 48 h. Values are the means ± SD from three independent experiments.
-
DU6A cells expressing wild‐type, T387A, or T387D STAT2 were placed into 96‐well plates (2,000 cells/well), and the cells were treated with IFN‐β (1,000 IU/ml) for 96 h. Cell survival was analyzed by the MTT assay. Values are the means ± SD from three independent experiments. One‐way ANOVA: ** P < 0.005, *** P < 0.001. Each experiment was carried out two independent times, with results similar to the representative examples that are shown.
Source data are available online for this figure.