
Figure 4. Kinetics of STAT2 T387 phosphorylation in response to IFN‐β and downregulation by CDK inhibitors.
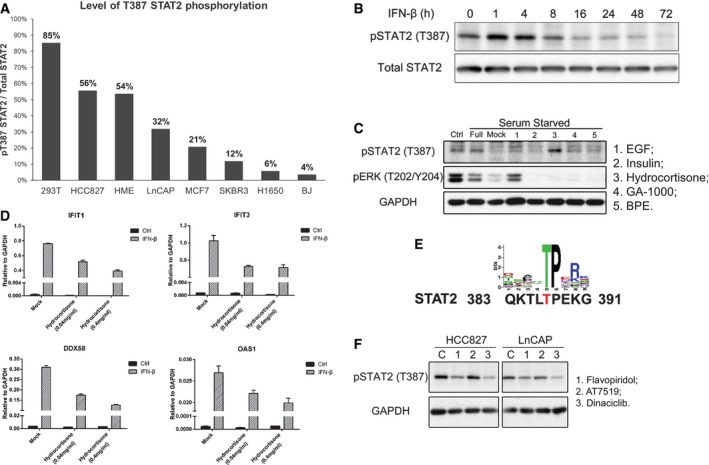
- An immunoprecipitation was performed using whole‐cell lysates from cells expressing Flag‐tagged wild‐type STAT2, and samples were analyzed by Western blot. The numbers in the chart are the proportions of T387‐phosphorylated STAT2 in each cell type, calculated in comparison with 293T cells.
- HME cells expressing wild‐type STAT2 were treated with IFN‐β (100 IU/ml). Whole‐cell lysates harvested at the times indicated were analyzed by Western blot.
- HME cells expressing wild‐type STAT2 were seeded in complete medium. On the second day, the cells were re‐fed with medium lacking supplements. On the third day, the cells were treated with each supplement for 4 h, and total lysates were analyzed by Western blot. 1: EGF; 2: insulin; 3: hydrocortisone; 4: GA‐1000; 5: BPE.
- HME cells were pre‐treated with hydrocortisone (0.04 and 0.4 mg/ml) for 3 h and then treated with IFN‐β (100 IU/ml). Cells were harvested after 4 h, and total RNAs were analyzed by real‐time PCR. Values are the means ± SD from three independent experiments.
- Consensus sequences for CDK‐catalyzed phosphorylation, compared to residues 383–391 of STAT2.
- HCC827 and LnCAP cells expressing wild‐type STAT2 were treated with CDK inhibitors (1 μM) for 4 h, and whole‐cell lysates were analyzed by Western blot. 1: flavopiridol; 2: AT7519; 3: dinaciclib.
Source data are available online for this figure.