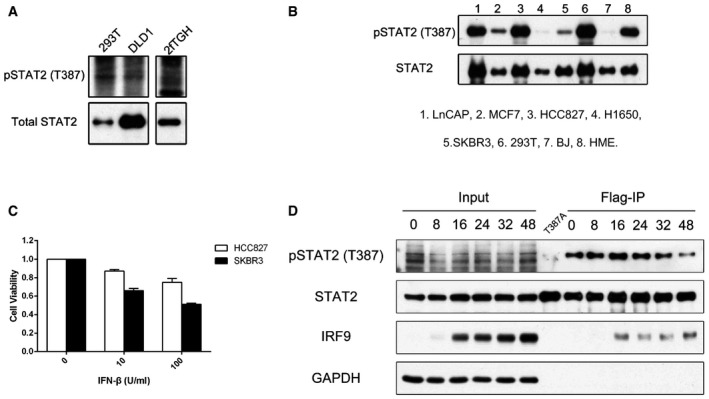
Immunoprecipitations of STAT2 were performed with whole‐cell lysates of 293T, DLD1, and 2fTGH cells, and samples were analyzed by Western blot.
STAT2, immunoprecipitated by means of a Flag tag from cells expressing wild‐type STAT2, was analyzed by Western blot. 1: LnCAP; 2: MCF7; 3: HCC827; 4: H1650; 5: SKBR3; 6: 293T; 7: BJ; 8: HME.
HCC827 and SKBR3 cells were placed into 96‐well plates (2,000 cells/well), and the cells were treated with IFN‐β (1,000 IU/ml) for 96 h. Cell survival was analyzed by the MTT assay. Each experiment was carried out two independent times, with results similar to the representative examples that are shown. Values are the means ± SD from three independent experiments.
STAT2 was immunoprecipitated by means of a Flag tag from U6A cells expressing wild‐type or T387A STAT2, treated with IFN‐β (100 IU/ml) at the times indicated. Cell extracts were analyzed by Western blot.