. 2017 Jan 17;36(2):213–231. doi: 10.15252/embj.201694628

Figure EV2. Loss of Srs2 does not affect DSB resection.

Figure EV2

  1. Schematic of unrepairable DSB used for comparative analysis of break resection in (B and C). HO recognition site is shown by black triangle, vertical arrows represent BglII restriction sites, and horizontal arrows depict distance (in bp, shown in brackets) from DSB to the three BglII restriction fragments monitored by Southern hybridization using the corresponding probes (black boxes labelled R5, R14 and R20). Notice, the DNA on the right hand side of the break is identical to that used in SSA assays (Fig 4A), while on the left, ura3‐52–KAN was replaced by HYG, thereby removing homology required for DSB repair by SSA.
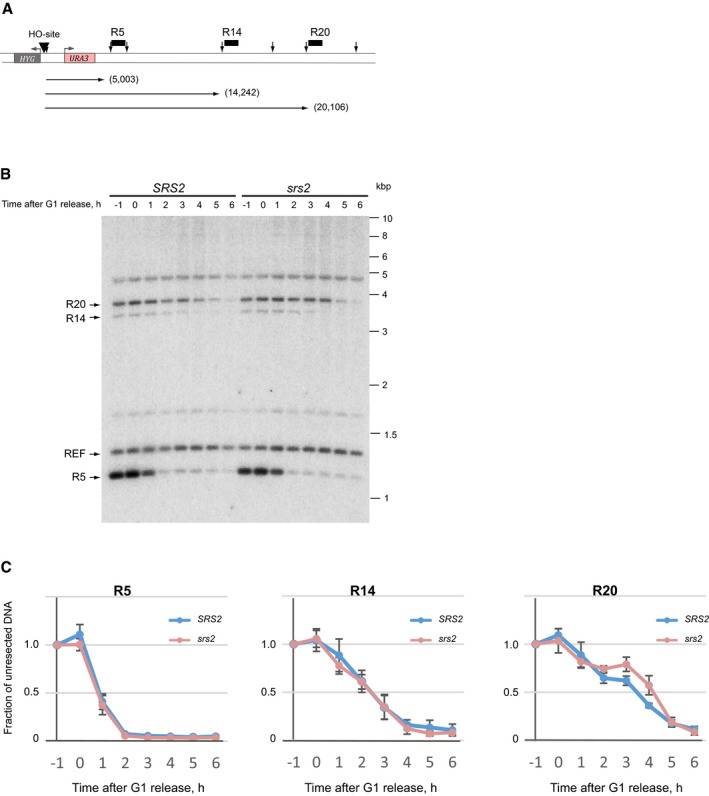
  2. A representative Southern blot image used for quantitative analysis of DSB resection. Four DNA fragments indicated by arrows on the left were used in the analyses: three chr.V fragments affected by resection and a chr.IV fragment containing ARS1 (TRP1 locus) used as a normalizer of DNA loading.
  3. Quantitative analysis of DSB resection in SRS2 and srs2 mutant cells over a time‐course experiment involving cell synchronization and DSB induction in G1 followed by release into S/G2. Average ± SD (n = 4) is shown for each time point.
Data information: Strains used: NK5728, NK5729; NK5754, NK5755.