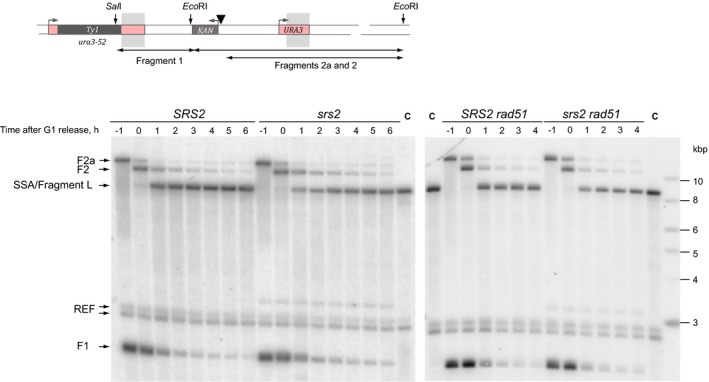
Figure EV3. Analysis of SSA by Southern blot hybridization in SRS2 and srs2Δ cells in the presence and absence of Rad51.

A schematic and representative Southern blot images are shown for fragment L (see Fig 4C for further explanation). A black triangle represents the HO site. Sites for the restriction enzymes used in the analysis of the corresponding DNA fragment are shown as vertical arrows. Hybridization probe spans the region of homology indicated by grey shadows. F1, F2, F2a correspond to fragment 1, 2 and 2a, respectively, indicated by two‐ended arrows at the bottom of the schematic; SSA, the product of repair (fragment L); REF, a fragment on chr.IV (ARS1 locus) detected by the reference probe; C, control strain. Numbers above each gel lane indicate time points in the time‐course experiments.
