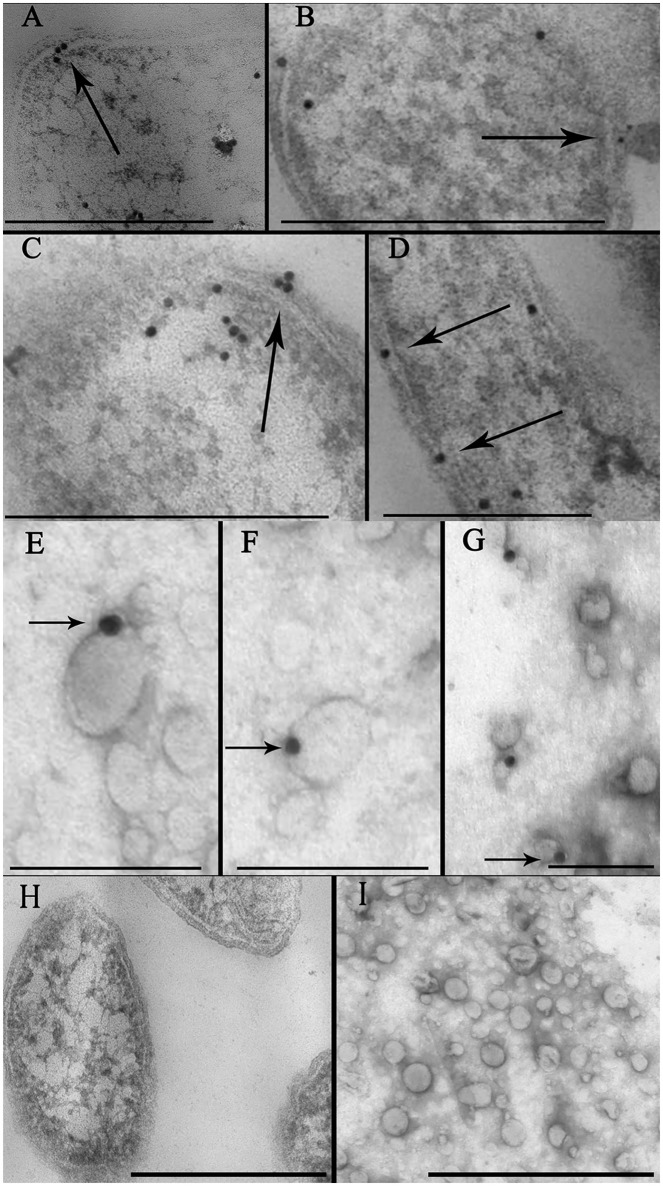
Figure 2.
Identification of toxin cell and OMV localization via immune-microscopy with antibodies against BFT. (A–D) Thin sections of ETBF cells analyzed by TEM contain some labels (black dots) coupled with antibodies against BFT fixed on periplasm and membrane (indicated by arrow). Several labels coupled with antibodies against BFT fixed on cytoplasm indicating probable toxin formation. Scale bars represent 300 nm for (A) and (D), 500 nm for (B) and (C). (E–G)—Negatively stained OMV preparations isolated from ETBF culture and coincubated with labels, (black dots indicated by arrow) coupled with antibodies against BFT were analyzed by TEM. Scale bars represent 100 nm for (E,F) and 150 nm for (G). (H) Thin section of NTBF cells analyzed by TEM contains no fixed labels coupled with antibodies against BFT. (I) Negatively stained OMV preparations isolated from NTBF culture contain no fixed labels coupled with antibodies against BFT. Scale bars represent 600 nm for (H) and 400 nm for (I).

