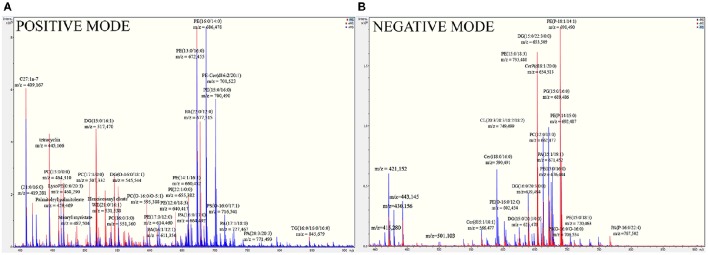
Figure 3.
Full mass spectra of B. fragilis lipids show the most represented lipids of B. fragilis membrane. (A) MS analysis of ETBF (colored in red) and NTBF (colored in blue) membrane in positive linear mode. (B) MS analysis of ETBF (colored in red) and NTBF (colored in blue) membrane in negative linear mode. B. fragilis cells membrane lipids were extracted by Folch method (see material and methods), dissolved in 200 μl ethanol and analyzed by quadruple time-of-flight tandem mass spectrometer. Mass spectrum of ETBF and NTBF in positive and negative linear mode showed the same cluster of peaks, indicating the most represented classes of lipids (PC, PE, DG, PA).

